 Facebook
 X
X
 Pinterest
 Copy Link
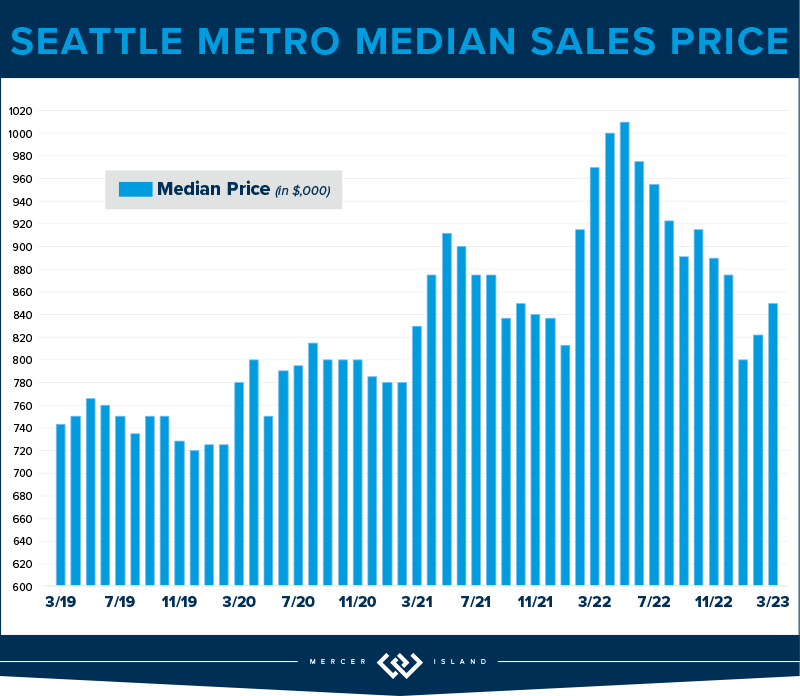
The first quarter of 2023 saw a price correction compared to last year’s spike, with year-over-year median prices down by 9% in Seattle and 14% on the Eastside. That being said, prices are already beginning to climb again with steady growth since the beginning of the year. Buyer demand remains strong despite higher interest rates—competitively priced, well-presented homes are still fetching multiple offers.
Click or scroll down to find your area report:
Seattle | Eastside | Mercer Island | Condos | Waterfront
SEATTLE
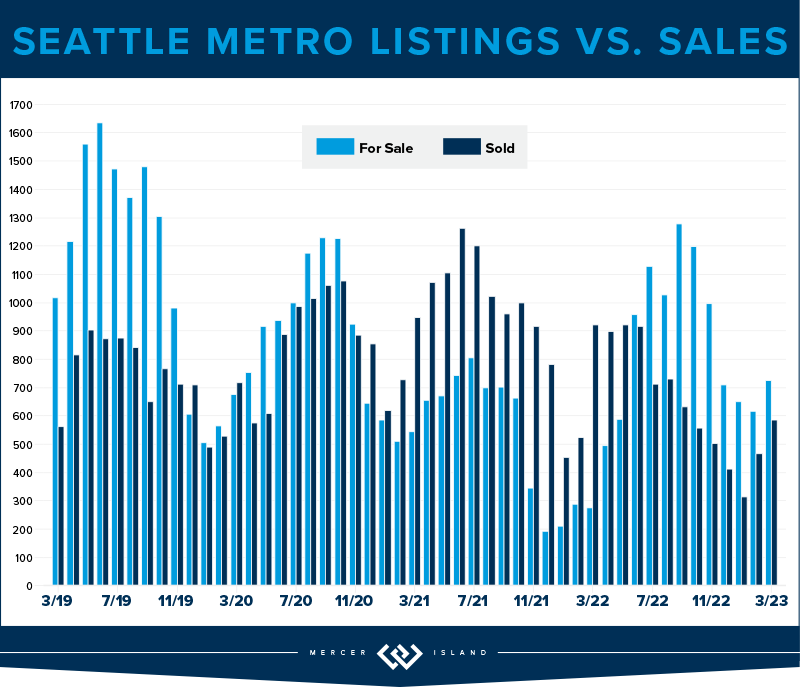
For those who purchased a home in Seattle this quarter, it likely felt like there were more options and inventory with a minor rebalance on price. While transactions were down 28% year over year, we also saw median sales price was down from $925,000 to $830,000 since last quarter, which is a 9% adjustment. A down correction in pricing gave relief to buyers feeling the pinch and stress of rising interest rates to 6.5%. Rates have doubled the past 1.5 years but, considering the limited supply of homes for sale, the drop in home prices hasn’t been severe.
Neighborhoods like Lake Forest Park saw growth in their number of transactions (up 15%); other neighborhoods like Madison Park and Capitol Hill had nearly half the homes for sale compared to last year. It’s no surprise that as interest rates rise and affordability changes, buyers are casting a wider net to other parts of Seattle to the north. Keep an eye on neighborhoods like Shoreline, Kenmore and Lake Forest Park. Desirable prices paired with accessible transit is a bonus for those who are being asked to return to the office.
Multiple offers are apparent in some neighborhoods (price & presentation is key!) and we did experience 30% of homes sell above their listing price. If the shortage of inventory remains and interest rates drop slightly, we could see the frequency of multiple offers increase.
Click here for the full report and neighborhood-by-neighborhood statistics!

EASTSIDE
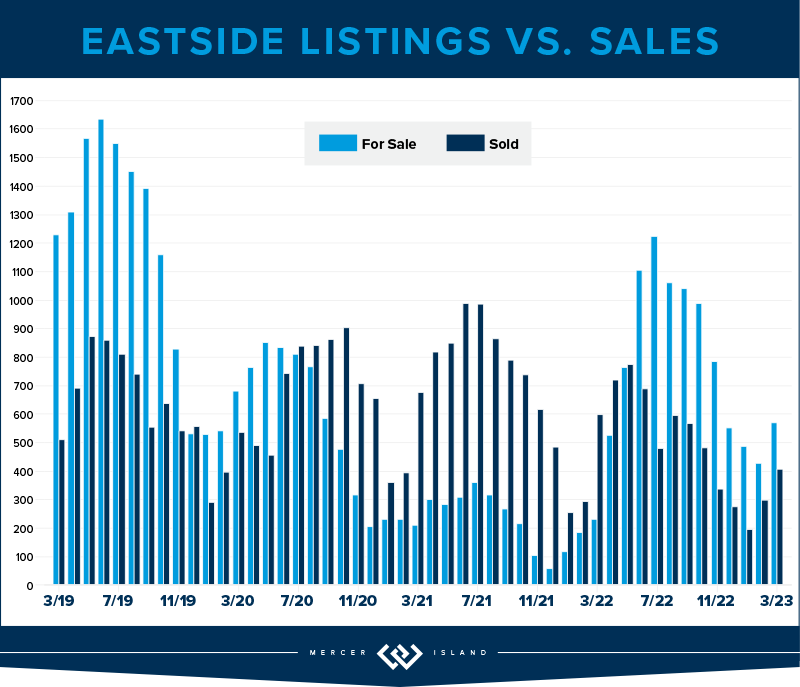
The Eastside was struck by job layoffs in the tech sector, rising interest rates and new property listings (28% more homes than last quarter!) but pending sales remained low compared to the previous year. Transaction volume was much like Seattle’s, with a decline of 22%. Mercer Island was the only community that stayed steady (no increase) in the number of transactions year over year.
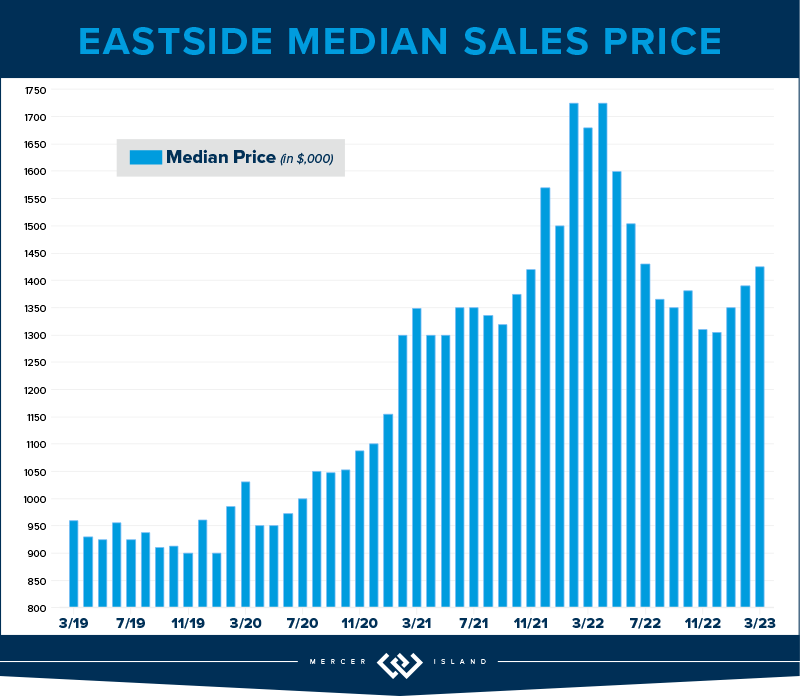
Interestingly, while prices are down to a median of $1,400,000 year over year, this is a slight 2% increase from last quarter’s median of $1,380,000. 20% of the properties on the Eastside also sold above their listing price (most of these homes were in Bellevue) while sellers needed a shift in expectations with a whopping 58% of homes needing a price improvement to find their buyer. The list price vs. sold price percentage was 97% which means if you were a seller who listed your home at $1,000,000, you would expect to sell for $970,000 this quarter. Again, price and presentation matter and 41% of sellers who did this well sold in the first 10 days.
Buyers who are shopping for homes on the Eastside continue to be hyper focused on the school districts, turn-key properties and are serious about locking in their interest rate now, with the hopes of refinancing later this year when economists predict rates could decrease. If rates drop below 5.5% coupled with low inventory levels, we could see the frequency of multiple offers increase.
Click here for the full report and neighborhood-by-neighborhood statistics!
MERCER ISLAND
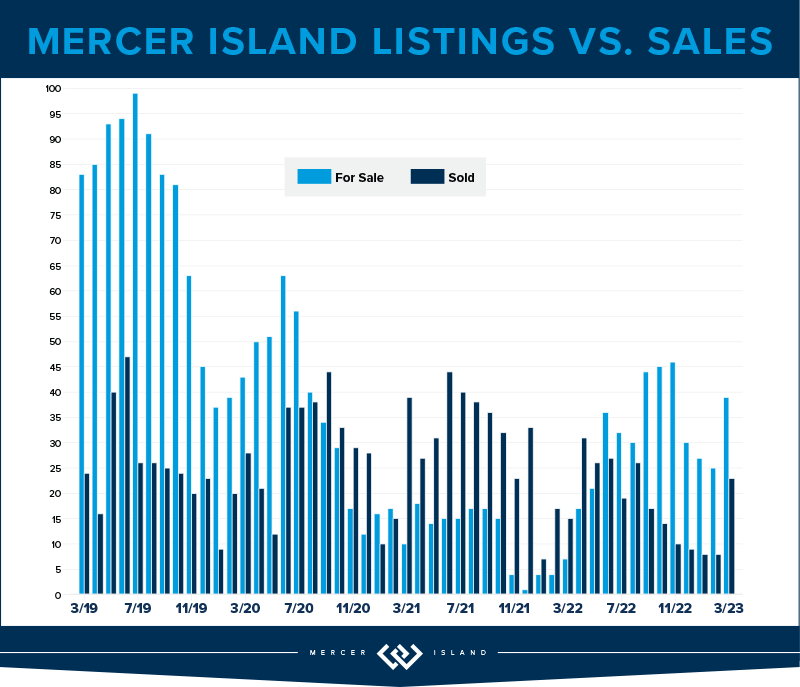
Even though there were just 39 residential transactions on Mercer Island this quarter, that number has stayed perfectly steady year over year. Over half of these homes sold in the first 10 days on the market, which is no surprise as demand has stayed robust.
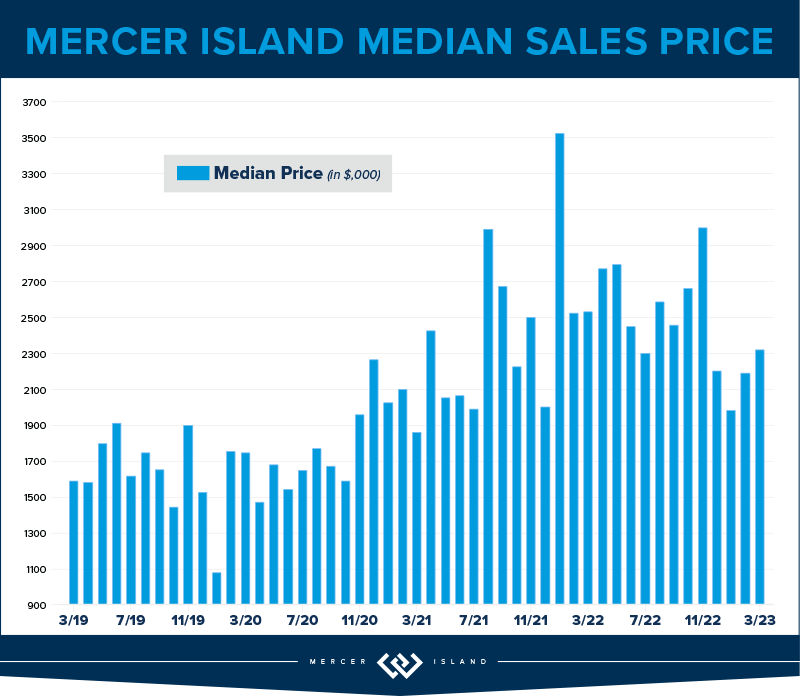
13% of listings sold above their listing price, but this wasn’t concentrated on a certain community; four homes located on First Hill, Mid-Island plus the South & North Ends respectively, each received multiple offers this quarter. Q1 of 2022 saw a median price of $2,540,000 with just one home listed under $1,500,000. This quarter, the median price is $2,233,000 (a 12% decline) while six homes sold under $1,500,000! Due to the decline in prices and a slower start to the year, many sellers needed a shift in expectations with a whopping 67% of homes needing a price improvement to find their buyer.
We haven’t seen the number of new listings in the double-digit figures since Q2 of 2022, and it’s very possible we won’t experience that same level of inventory this year. Baby boomers are holding onto their homes with the benefit of their remarkably low 2.75% interest rate, and families are staying put to finish out the school year.
Our advice still stands: if you’re thinking about waiting for lower rates AND lower prices, you might be dreaming. Enjoy the fantastic Island inventory now, lock in your rate and consider refinancing later this year or next spring when economists predict rates will shift down.
Click here for the full report and neighborhood-by-neighborhood statistics!

CONDOS – SEATTLE & EASTSIDE
Seeing first time homebuyers come back to the market or considering an investment? Buying a condo in Seattle or on the Eastside is a fantastic opportunity, especially as many companies are calling their employees back to the office at least 3 days per week. It’s very possible transaction volume will be up next quarter, but for now, transactions were down 44% year over year. With that said, 465 units sold in Seattle; 347 units sold on the Eastside which isn’t all doom and gloom.
Just like North Seattle is heating up with residential sales, Lake Forest Park, Shoreline, Ballard and North Seattle condos outpace the rest of Seattle, up 10% on average. These areas are experiencing new construction townhomes that are especially desirable to first time homebuyers. Boutique builders are offering a trendy design palette (have you seen the Scandinavian-style design with light woods and sleek finishes?) paired with all the “bells and whistles” that city dwellers appreciate, like dog washing stations, artificial turf, and EV chargers.
For the Eastside, Redmond condos stayed the steadiest, down just 17% year or year. Kirkland was the only neighborhood to experience a price bump, up 11% to a median price of $693,000.
The Seattle condo median price has declined just 1% year over year to $515,000, while the Eastside experienced a 12% adjustment to $550,000. This is a $530,000 average when comparing both areas. With interest rates doubling the past 1.5 years and buyers considering a condo unit under the umbrella of a condo association, shoppers will be very particular about their monthly dues assessment and what’s included for those monies as both interest rates and dues have such a dominant effect on their overall buying power. Condos continue to be a necessary niche in our marketplace!
Check out area-by-area details the full condo report.

WATERFRONT
There were 17 privately-owned waterfront home sales in the greater Seattle-Eastside region in Q1 2023 (Eastside-7; Seattle-6; Lake Sammamish-2; Mercer Island-2). This is exactly on par with last year, when we also saw 17 sales in Q1 2022.
The highest sale was for a Medina Northwest Contemporary on 115 feet of low-bank waterfront that sold above list price for $20m. The most affordable waterfront was a unique triplex with 1920-1930 era beach cottages on a private boardwalk near the Ballard Locks—a buyer snagged it below list price for $1.9m.
This brief overview of the entire Seattle-Eastside private waterfront market, including Mercer Island and Lake Sammamish, illustrates the trends occurring in our region over time. This data is interesting and insightful but cannot replace an in-depth waterfront analysis with your trusted professional.

© Copyright 2023, Windermere Real Estate/Mercer Island. Information and statistics derived from Northwest Multiple Listing Service and Trendgraphix, and deemed accurate but not guaranteed. Mercer Island cover photo courtesy of Petra Varney and Clarity Northwest Photography.
