 Facebook
 X
X
 Pinterest
 Copy Link

Home values held steady in 2025 with many communities seeing modest price gains. Seattle Metro’s median sale price and $ per sq. ft. both rose year-over-year, while the Eastside’s numbers remained similar to what we saw in 2024. Both areas saw double-digit spikes in the number of new listings and a slight slowdown in the number of sales.
Looking forward: this is a great year to invest! We’ve had a few back-to-back years of soft price gains, which feel like losses in our frequently HOT Seattle. This is as close to a “buyer’s advantage” market as we’ve seen in years. At the time of writing this, interest rates are available in the high 5’s. The cost of money is reasonable and the cost of property has not risen drastically in a few years. This is the perfect time to jump in for investors and first-time buyers. More specifically, anyone who can buy “unburdened” or without having to sell/carry two mortgages in order to buy. The condo and townhome markets continue to be a great opportunity for those looking to take the first step onto the property ladder. If none of this applies to you, remember: if you’re looking to buy and sell within the same market, you only get an advantage on one side.
Click or scroll down to find your area report:
Seattle | Eastside | Mercer Island | Condos | Waterfront
SEATTLE
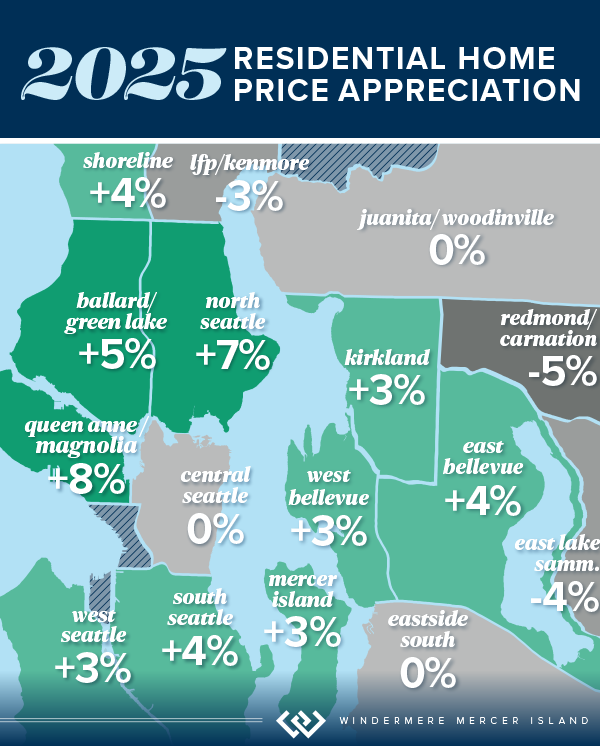
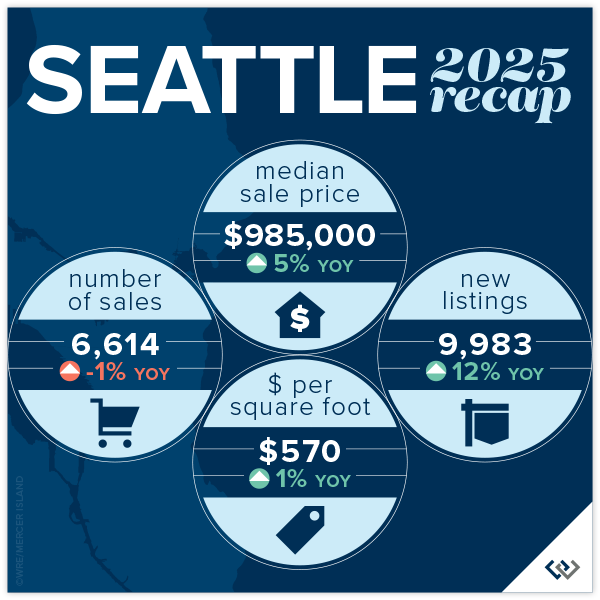
It’s all good news in the city of Seattle! The median price rose by 5% to $985,000. Pricing remained competitive, with 64% of homes selling at or above their list price (despite the fact that new listings increased 12% from 2024 and the number of sales dipped slightly).
Sales activity moved quickly in many neighborhoods. Citywide, 55% of homes sold within the first 10 days on market. Several areas posted strong performance, including Ballard & Green Lake with 1,705 homes sold, and North Seattle with 1,040 sales. Median prices varied by neighborhood, ranging from $794,000 in South Seattle to $1,399,000 in Queen Anne & Magnolia, reflecting the diversity of Seattle’s housing market.
Remember, these statistics include new construction data. In an inventory-constricted market, new construction data can skew pricing stats significantly. Check with your agent for how this affects your neighborhood.
Click here for the full report and neighborhood-by-neighborhood statistics!

EASTSIDE
Across the Greater Eastside, 5,458 homes sold during the year, down 5% compared to 2024. New inventory increased, with 8,259 new listings coming to market—up 16%! Fifty-five percent of homes sold at or above their list price, and 53% sold within the first 10 days on market, highlighting consistent transaction pace and buyer confidence across the region. Despite this, the median sale price held flat at $1,599,000 compared to 2024, while homes sold for an average of $688 per square foot, also similar to last year.
Several communities recorded notable activity levels, including Woodinville with 1,235 homes sold and East of Lake Sammamish with 1,134 sales. East Bellevue saw a 13% increase in homes sold, while Redmond posted a 15% increase in sales volume. Median sale prices varied by community, ranging from $1,281,000 in Woodinville to $3,688,000 in West Bellevue, reflecting the diversity of the Eastside housing market.
Several communities recorded notable activity levels, including Woodinville with 1,235 homes sold and East of Lake Sammamish with 1,134 sales. East Bellevue saw a 13% increase in homes sold, while Redmond posted a 15% increase in sales volume. Median sale prices varied by community, ranging from $1,281,000 in Woodinville to $3,688,000 in West Bellevue, reflecting the diversity of the Eastside housing market.

Click here for the full report and neighborhood-by-neighborhood statistics!
MERCER ISLAND
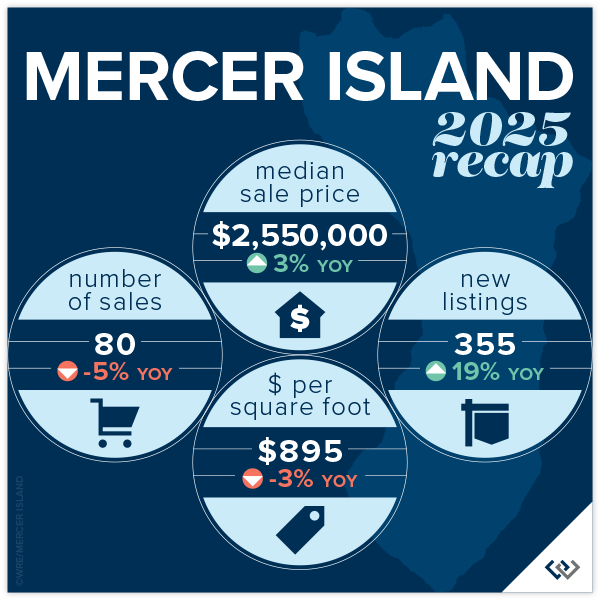
The 2025 Mercer Island real estate data reflects a year of steady activity and modest price gains. Median home prices rose 3% year over year to $2,550,000. Homes sold for an average of $895 per square foot, and half of all homes sold at or above their list price. Sales moved efficiently, with 56% of homes selling within the first 10 days on market.
A total of 80 single-family homes sold on Mercer Island during the year. Activity varied by neighborhood, with sales recorded across Northend, Southend, Mid-Island, First Hill, Westside, and The Lakes. Median home prices ranged from $1,775,000 in Mercerdale to $5,831,000 on the Westside, highlighting the range of housing options across the island.
Click here for the full report and neighborhood-by-neighborhood statistics!
CONDOS – SEATTLE & EASTSIDE
The 2025 Condo Report shows steady, encouraging activity across both the Seattle and Eastside condo markets. Year over year, condo sale prices increased a combined 2% to a median of $630,000, with homes selling for an average of $633/sq.ft. Half of all condos sold at or above their list price, signaling stable buyer demand. Inventory also expanded, with 8,331 new condo listings—up 14% from 2024! This is great news, increased supply that didn’t cause a price ‘dump’, it shows our Buyers may be returning to confidence around condos.
In Seattle, 2,695 condos sold during the year, a 9% increase in sales volume. The median Seattle condo price rose 2% to $585,000, and 51% of homes sold at or above list price. On the Eastside, 2,050 condos sold, with median prices increasing 5% year over year to $730,000. Eastside condos averaged $643 per square foot, with 51% selling at or above list price and 36% selling within the first 10 days. The market showed a combined 52 average days on market, with a 99% list to sales price ratio. Though, when original list to sales price ratio is compared the average sits at 97%. This means that patience and active calibration are both required when marketing your condo.
Mercer Island’s condo market also trucked along with 27 sales and a slight 1% year-over-year boost in median prices. Condos sold for an average of $591 per square foot, up 13% over 2024. Thirty-seven percent of condos sold at or above list price, and within the first 10 days. Inventory expanded as well, with 355 new condo listings, up 19% from 2024.
Check out area-by-area details in the full condo report.

WATERFRONT
Seattle saw a boost in the number of waterfront sales in 2025, with 36 compared to 31 in 2024. Lake Sammamish sales were similar to last year (31 vs. 30 in 2024), while Mercer Island and the Eastside both saw slight dips their sales numbers.
Mercer Island had the highest waterfront sale of the year at $25 million for a nearly 10,000 sq. ft. European Modern home on 102 feet of prime west-facing North End waterfront. The most modest sale was in Bellevue at $1.75 million for an original 1960s beach house on 50 feet of lakefront.
This brief overview of the entire Seattle-Eastside private waterfront market, including Mercer Island and Lake Sammamish, illustrates the trends occurring in our region over time. This data is interesting and insightful but cannot replace an in-depth waterfront analysis with your trusted professional.
View the full waterfront report


We earn the trust and loyalty of our brokers and clients by doing real estate exceptionally well. The leader in our market, we deliver client-focused service in an authentic, collaborative, and transparent manner and with the unmatched knowledge and expertise that comes from decades of experience.
© Copyright 2026, Windermere Real Estate/Mercer Island. Information and statistics derived from Northwest Multiple Listing Service and Trendgraphix, and deemed accurate but not guaranteed.
